From Raw Data to Scientific Insight – Your Data Deserves the Best Analysis
Prepare Data
Define Research Questions
Automatic Test Selection
Interpret Results
Generate Report
The complete thesis statistics guide behind Statoria
If you want more than quick answers, the eBook gives you the full step-by-step workflow.
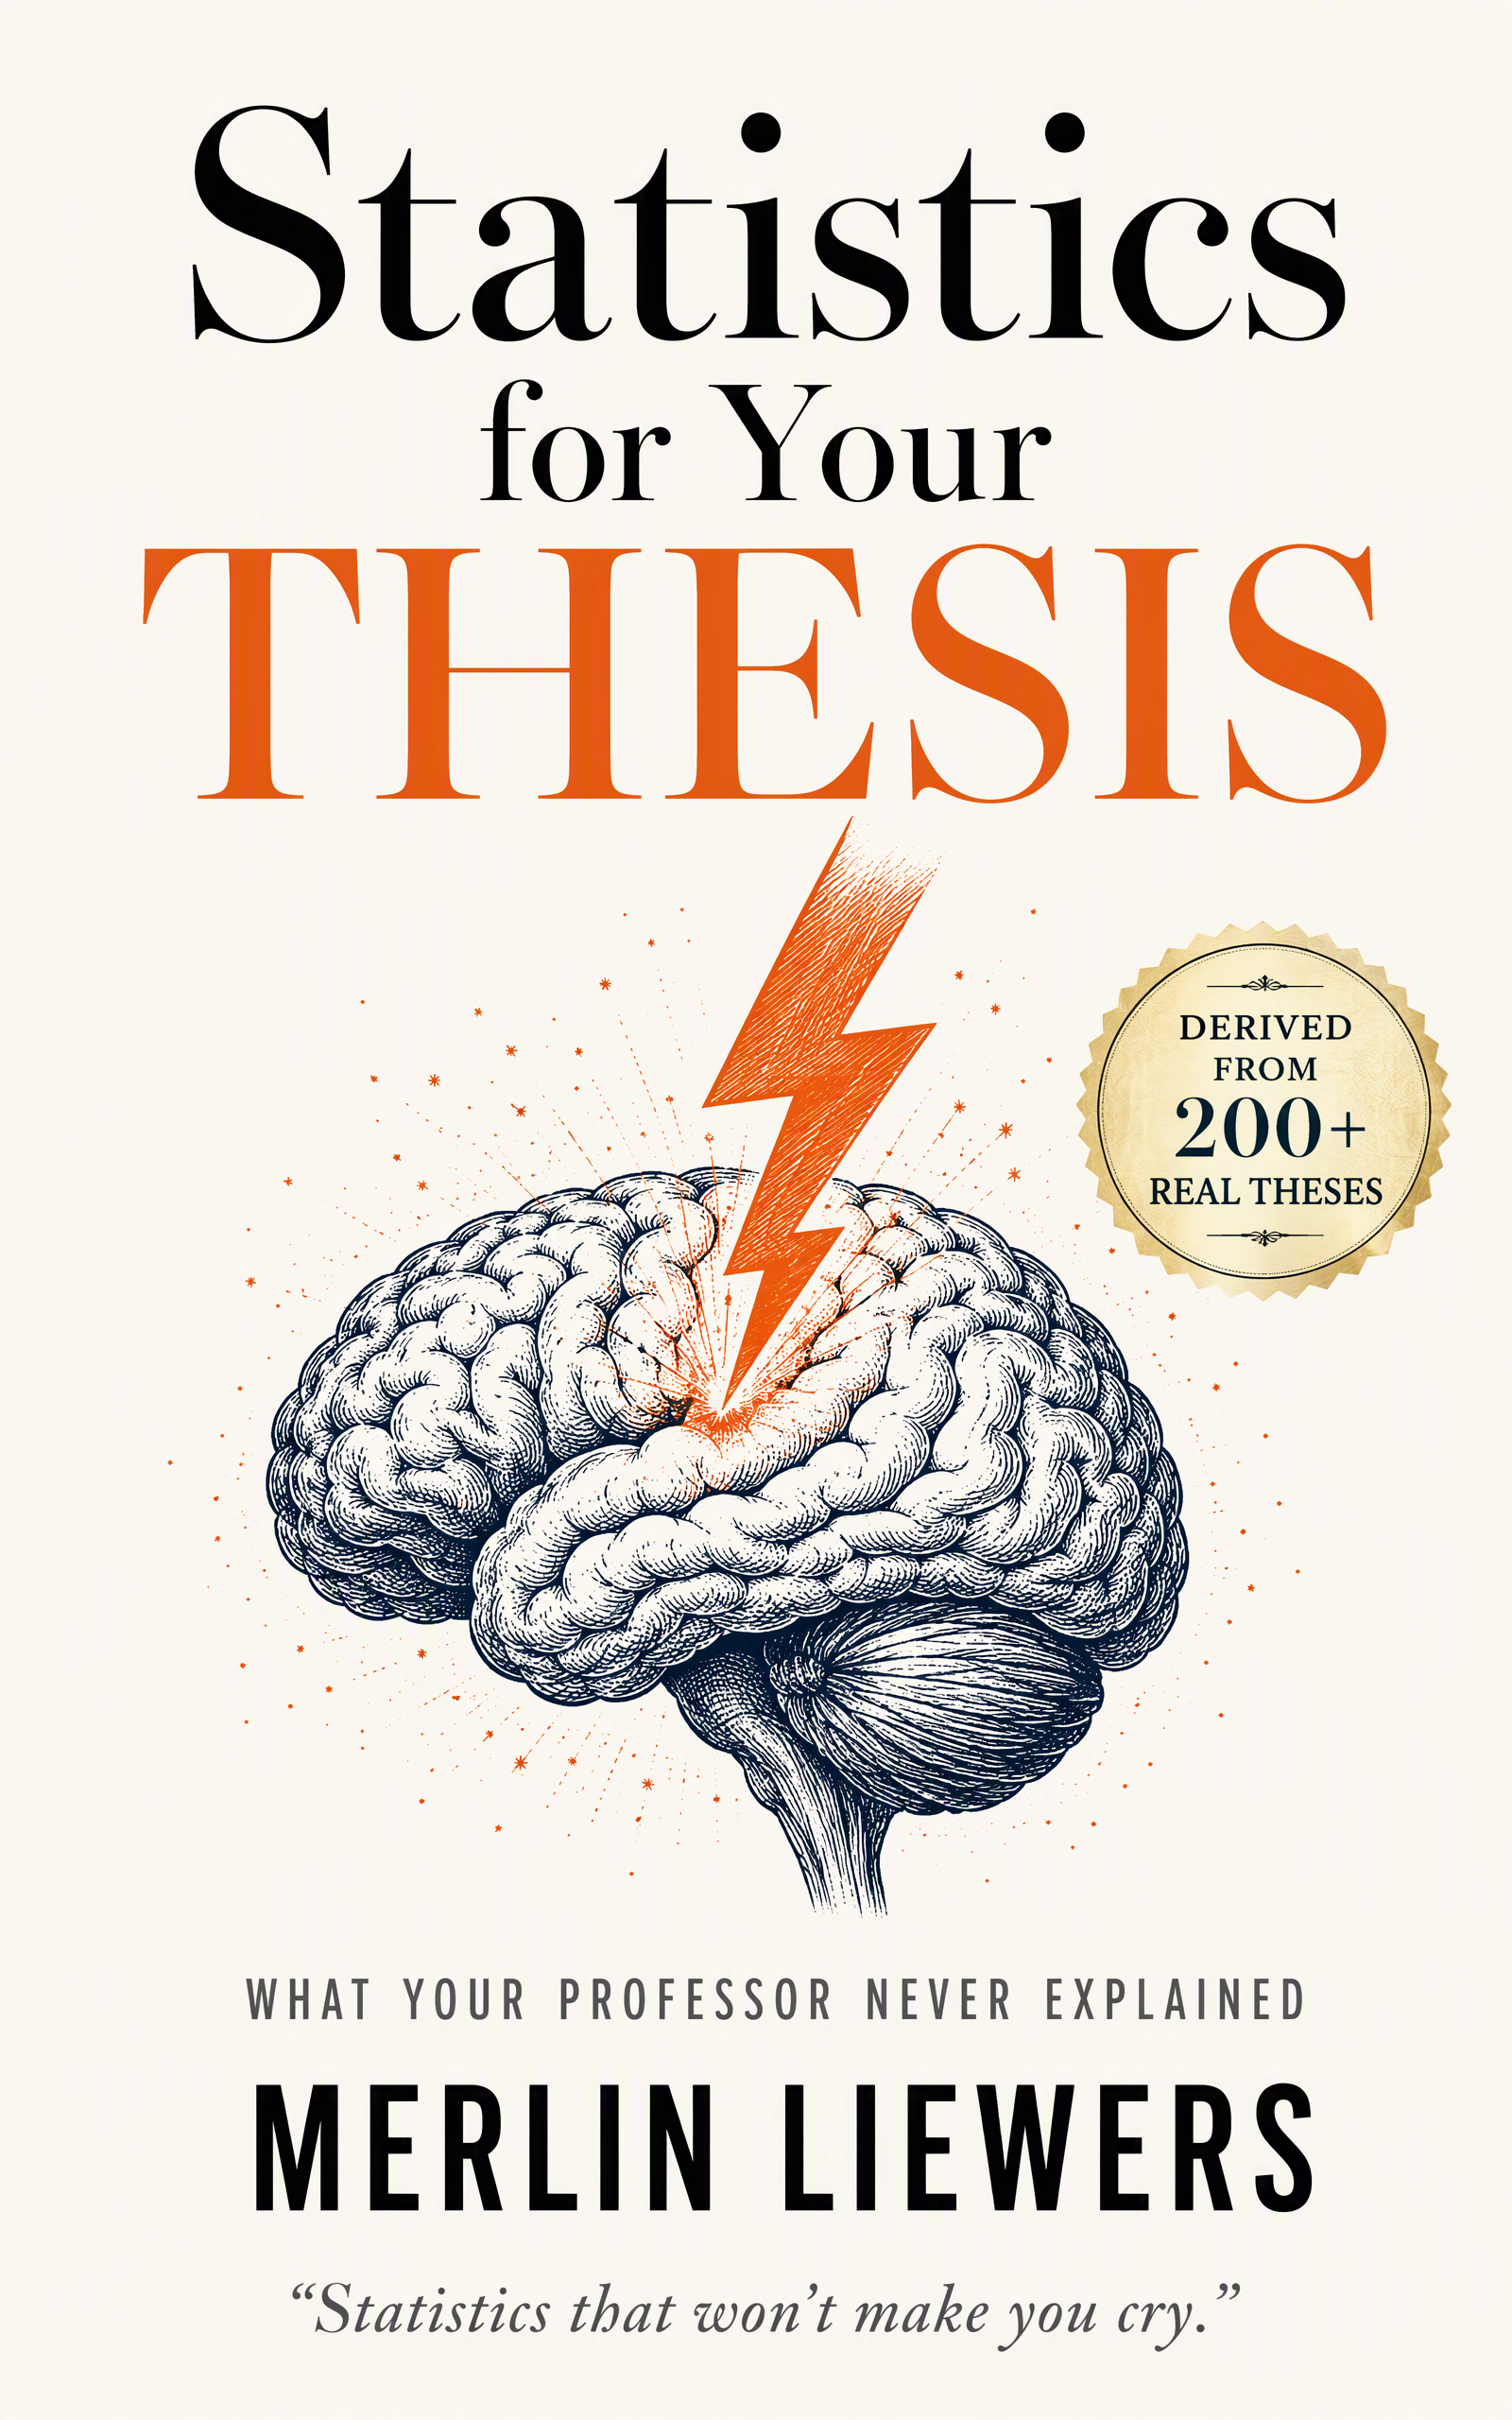
eBook
Statistics for Your Thesis
Made for bachelor and master theses · Practical examples · No prior statistics knowledge required
How Statoria works
Statoria is a guided statistics platform for bachelor and master theses. Upload your data, formulate your hypothesis, and get the right test, complete assumption checks, and APA-ready results — without a statistics degree.
What is Statoria?
Statoria is a guided statistics platform for bachelor and master theses. Upload your data, formulate your hypothesis, and get the right test, complete assumption checks, and APA-ready results — without a statistics degree.

Guided test selection
Statoria automatically recommends the right test based on your variables and research question.

No syntax, no formulas
No code to write, no SPSS menus to search through.

Assumptions checked for you
Statoria automatically checks normality, homogeneity of variance, and other assumptions.

APA-ready results
Every analysis gives you a clear summary with APA wording.
Your analysis workflow in 4 steps
Upload your data
CSV or Excel — Statoria detects column types, missing values, and outliers automatically.
Formulate your hypothesis
Select your dependent and independent variables.
Run the analysis
Statoria runs the test, checks all assumptions, and calculates effect sizes.
Interpret your results
You get a clear summary with APA wording.
Without Statoria vs. With Statoria
Without Statoria
- ✗Hours of research: Which test do I use?
- ✗Jumping between SPSS, YouTube, and tutorials
- ✗Assumptions missed or misinterpreted
- ✗Painfully piecing together APA wording from examples
- ✗Weeks to complete the analysis
With Statoria
- Automatic test recommendation in seconds
- One guided workflow — start to finish
- Assumptions automatically checked and explained
- APA-ready wording straight from the analysis
- Analysis in minutes, not weeks
What part of thesis statistics are you stuck with?
Pick your problem. Statoria gives you the right guide, free software, or eBook.

I don't know which test to use
Find the right test in 2 minutes.

I need to analyze my data
Upload your data and follow a guided workflow.
I need to write APA results
Learn how to report p-values, effect sizes, and confidence intervals correctly.

I'm confused by p-values and effect sizes
Understand what your statistical result actually means.

I use SPSS, JASP, or jamovi
Compare tools and see how Statoria fits into your workflow.

I want the complete step-by-step guide
Get the eBook with decision tree, checklists, and templates.
Why researchers without statistical knowledge choose Statoria
| STATORIA | R | SPSS | |
|---|---|---|---|
| Data preparation without code | |  | |
| Hypothesis-guided analysis (automatic) | | | |
| Automatic assumption checks | | | |
| Result interpretation aids | | | |
| Required statistical knowledge | Low | High | High |
| All standard tests available | | | |
| Method research | Low | High | High |
| Intuitive user interface | Very easy | None | Medium |
Why Academics Love Statoria
Give the freedom to analyze, the confidence to move fast, and the clarity to succeed-every step of the way.
We analyze your data and research question to recommend the mathematically correct statistical test automatically. No more uncertainty - get the right choice every time.
An always-on analysis engine.
Whether it's one dataset or one thousand, Statoria reduces friction across the entire research lifecycle - enabling faster analysis, quicker insights, and more publications.
Learn moreThis is what your test result looks like
Answer 5 questions in the Test Finder and get an instant recommendation.
Relationship test
Pearson correlation
Relationship between two metric variables
APA wording
A Pearson correlation was used to examine the relationship between study hours and exam score.
Data becomes scientific breakthroughs
- One-sample t-Test (vs. theoretical value)
- Paired t-Tests (Before-After)
- Independent t-Tests (2 Groups)
- One-way ANOVA (3+ Groups)
- Multifactorial ANOVA (2+ Factors)
- Repeated Measures ANOVA (within-subjects)
- MANOVA (Multivariate Analysis of Variance)
- Wilcoxon Signed-Rank Test (1 Sample)
- Wilcoxon Signed-Rank Test (paired)
- Mann-Whitney U Test (2 Groups)
- Kruskal-Wallis Test (3+ Groups)
- Pearson Product-Moment Correlation
- Linear Regression (univariate)
- Multiple Regression (multivariate)
- Spearman Rank-Correlation
- Chi-Square Test of Independence
- Shapiro-Wilk Test (normality, n < 50)
- Kolmogorov-Smirnov Test (normality, n ≥ 50)
- Levene's Test (variance homogeneity)
- Durbin-Watson Test (autocorrelation)
- VIF Analysis (multicollinearity)
- Residual Analysis
- QQ Plots (visual inspection)
- Sample Size Check
- Normality of Differences

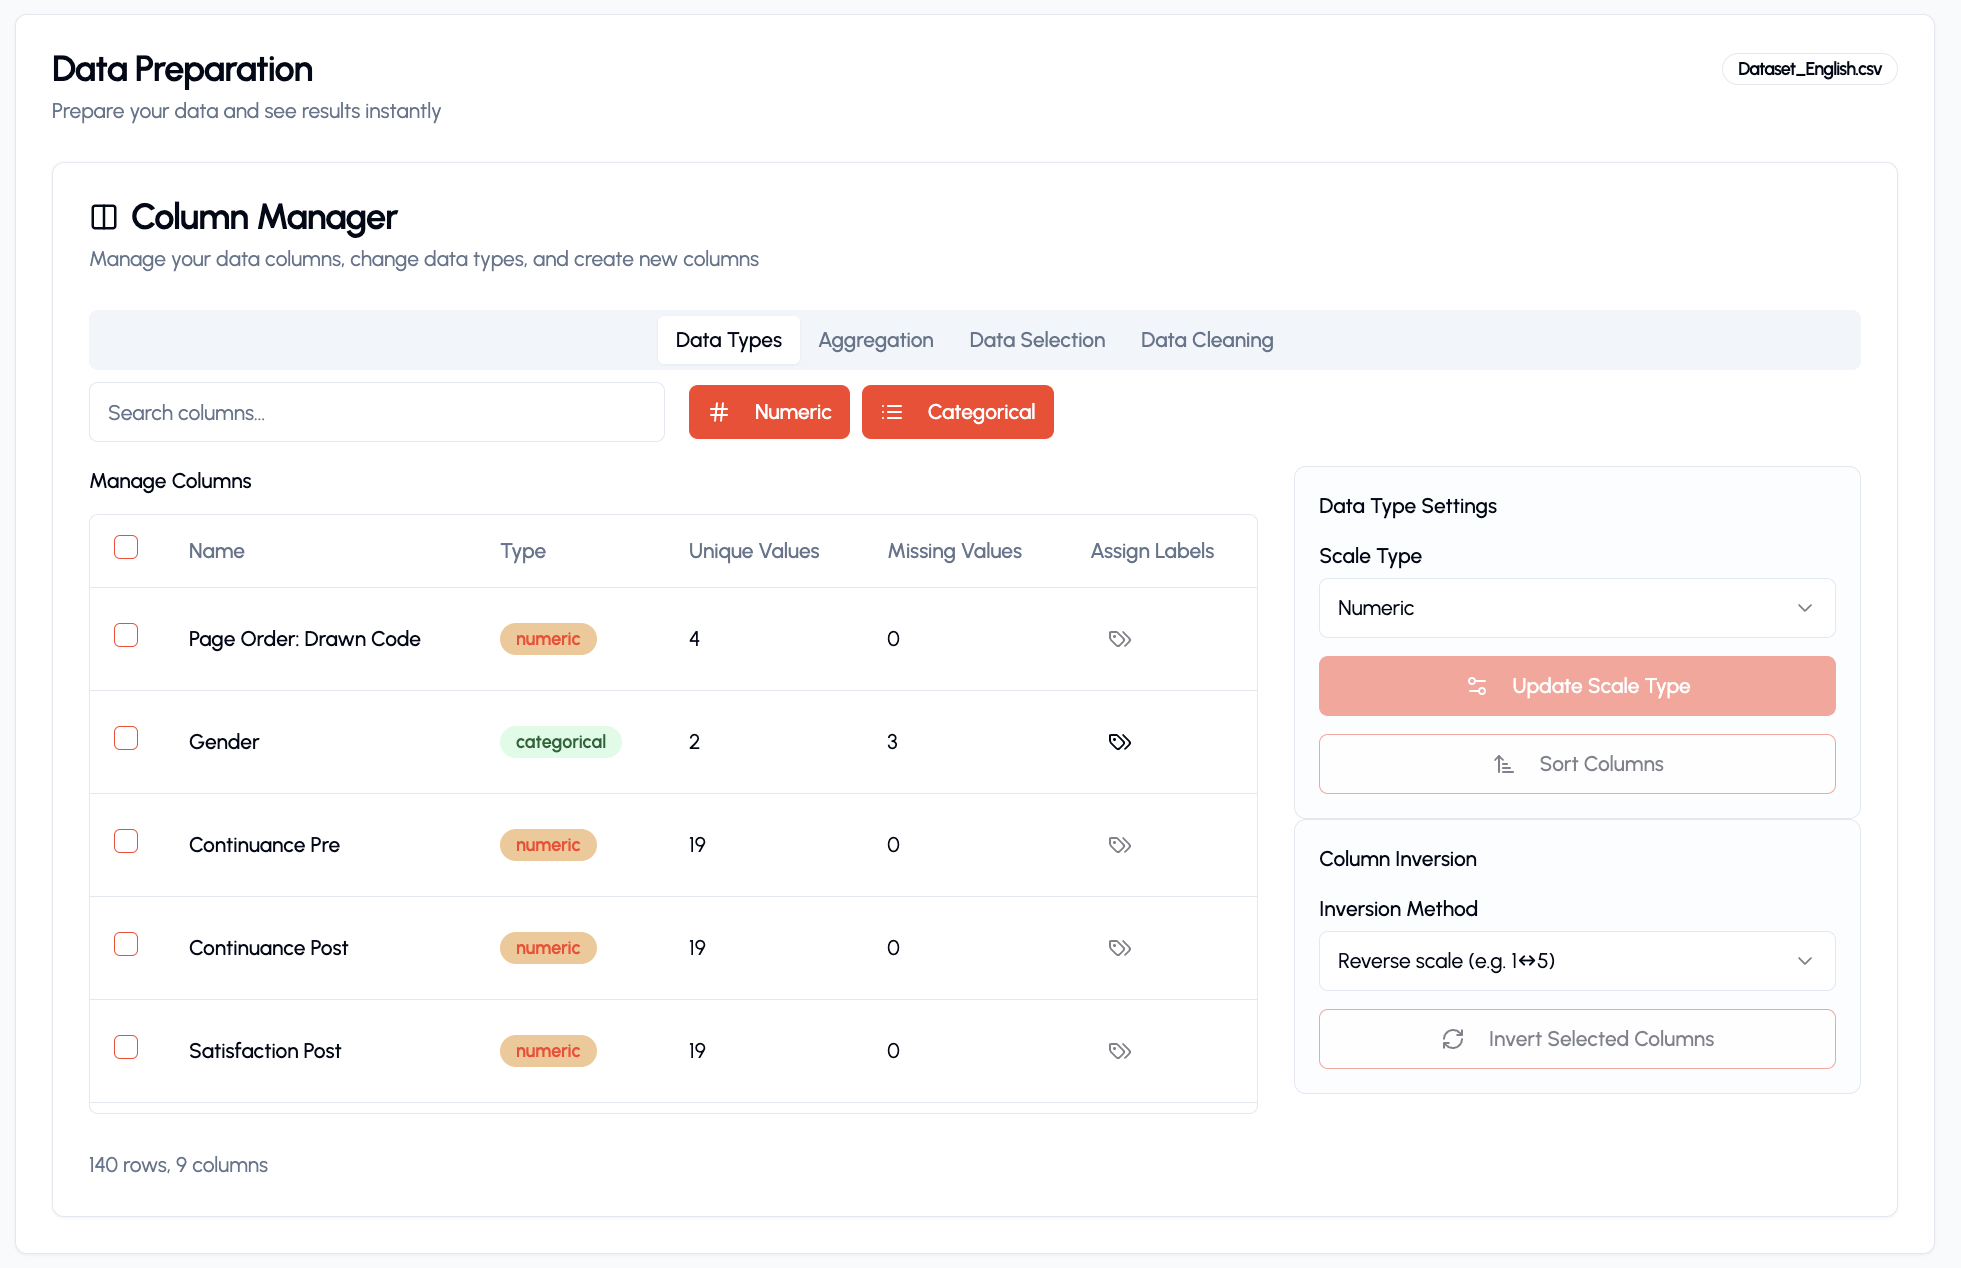
Data preparation without limits
Seamlessly upload diverse formats, guided clean and structure your datasets, and overcome the most frustrating part of research.
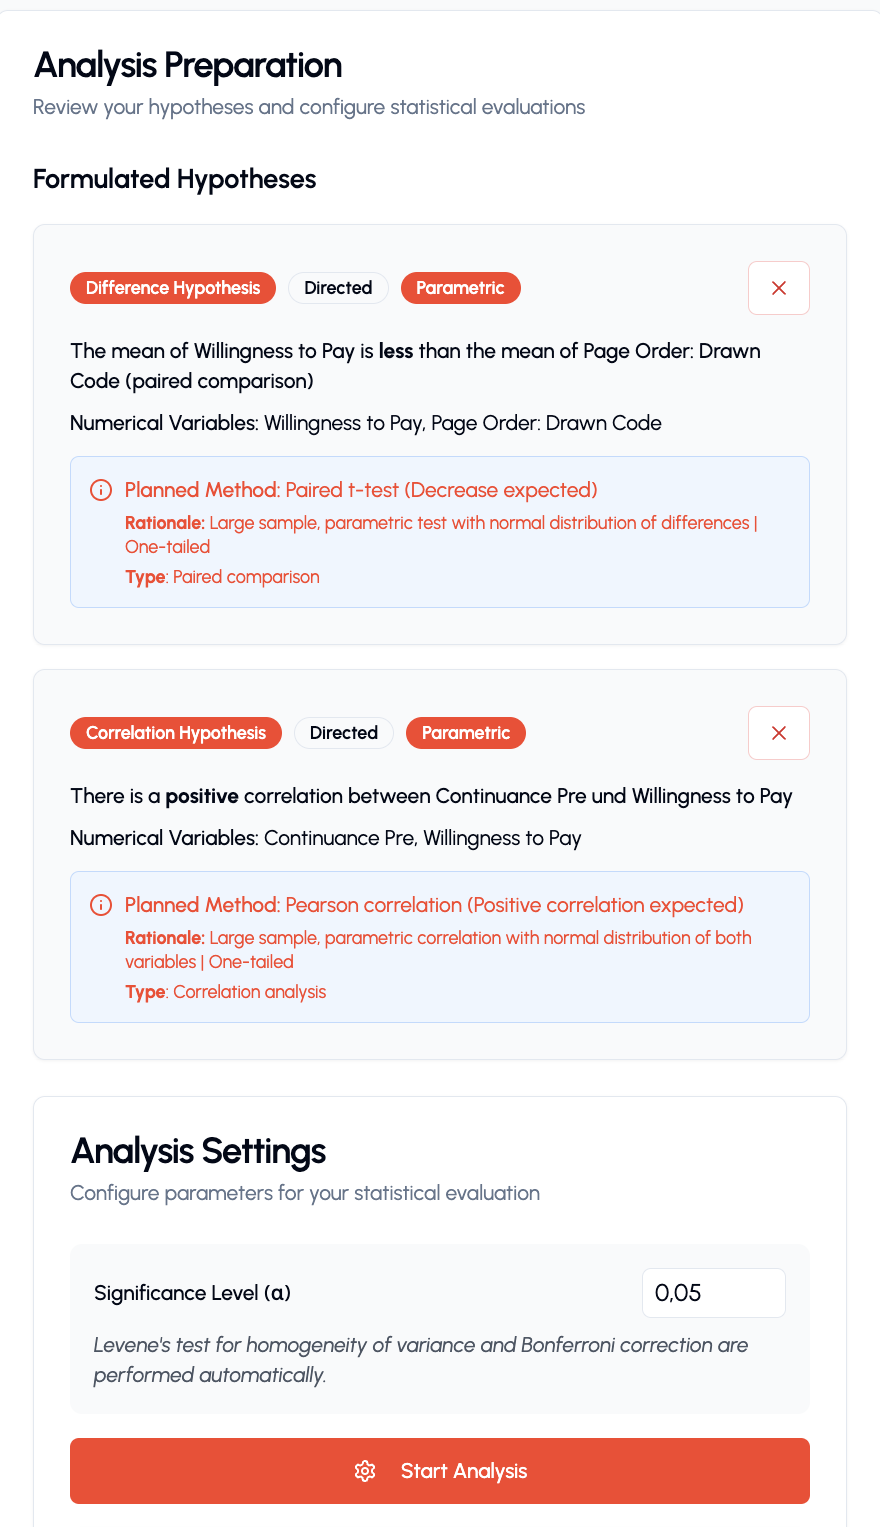
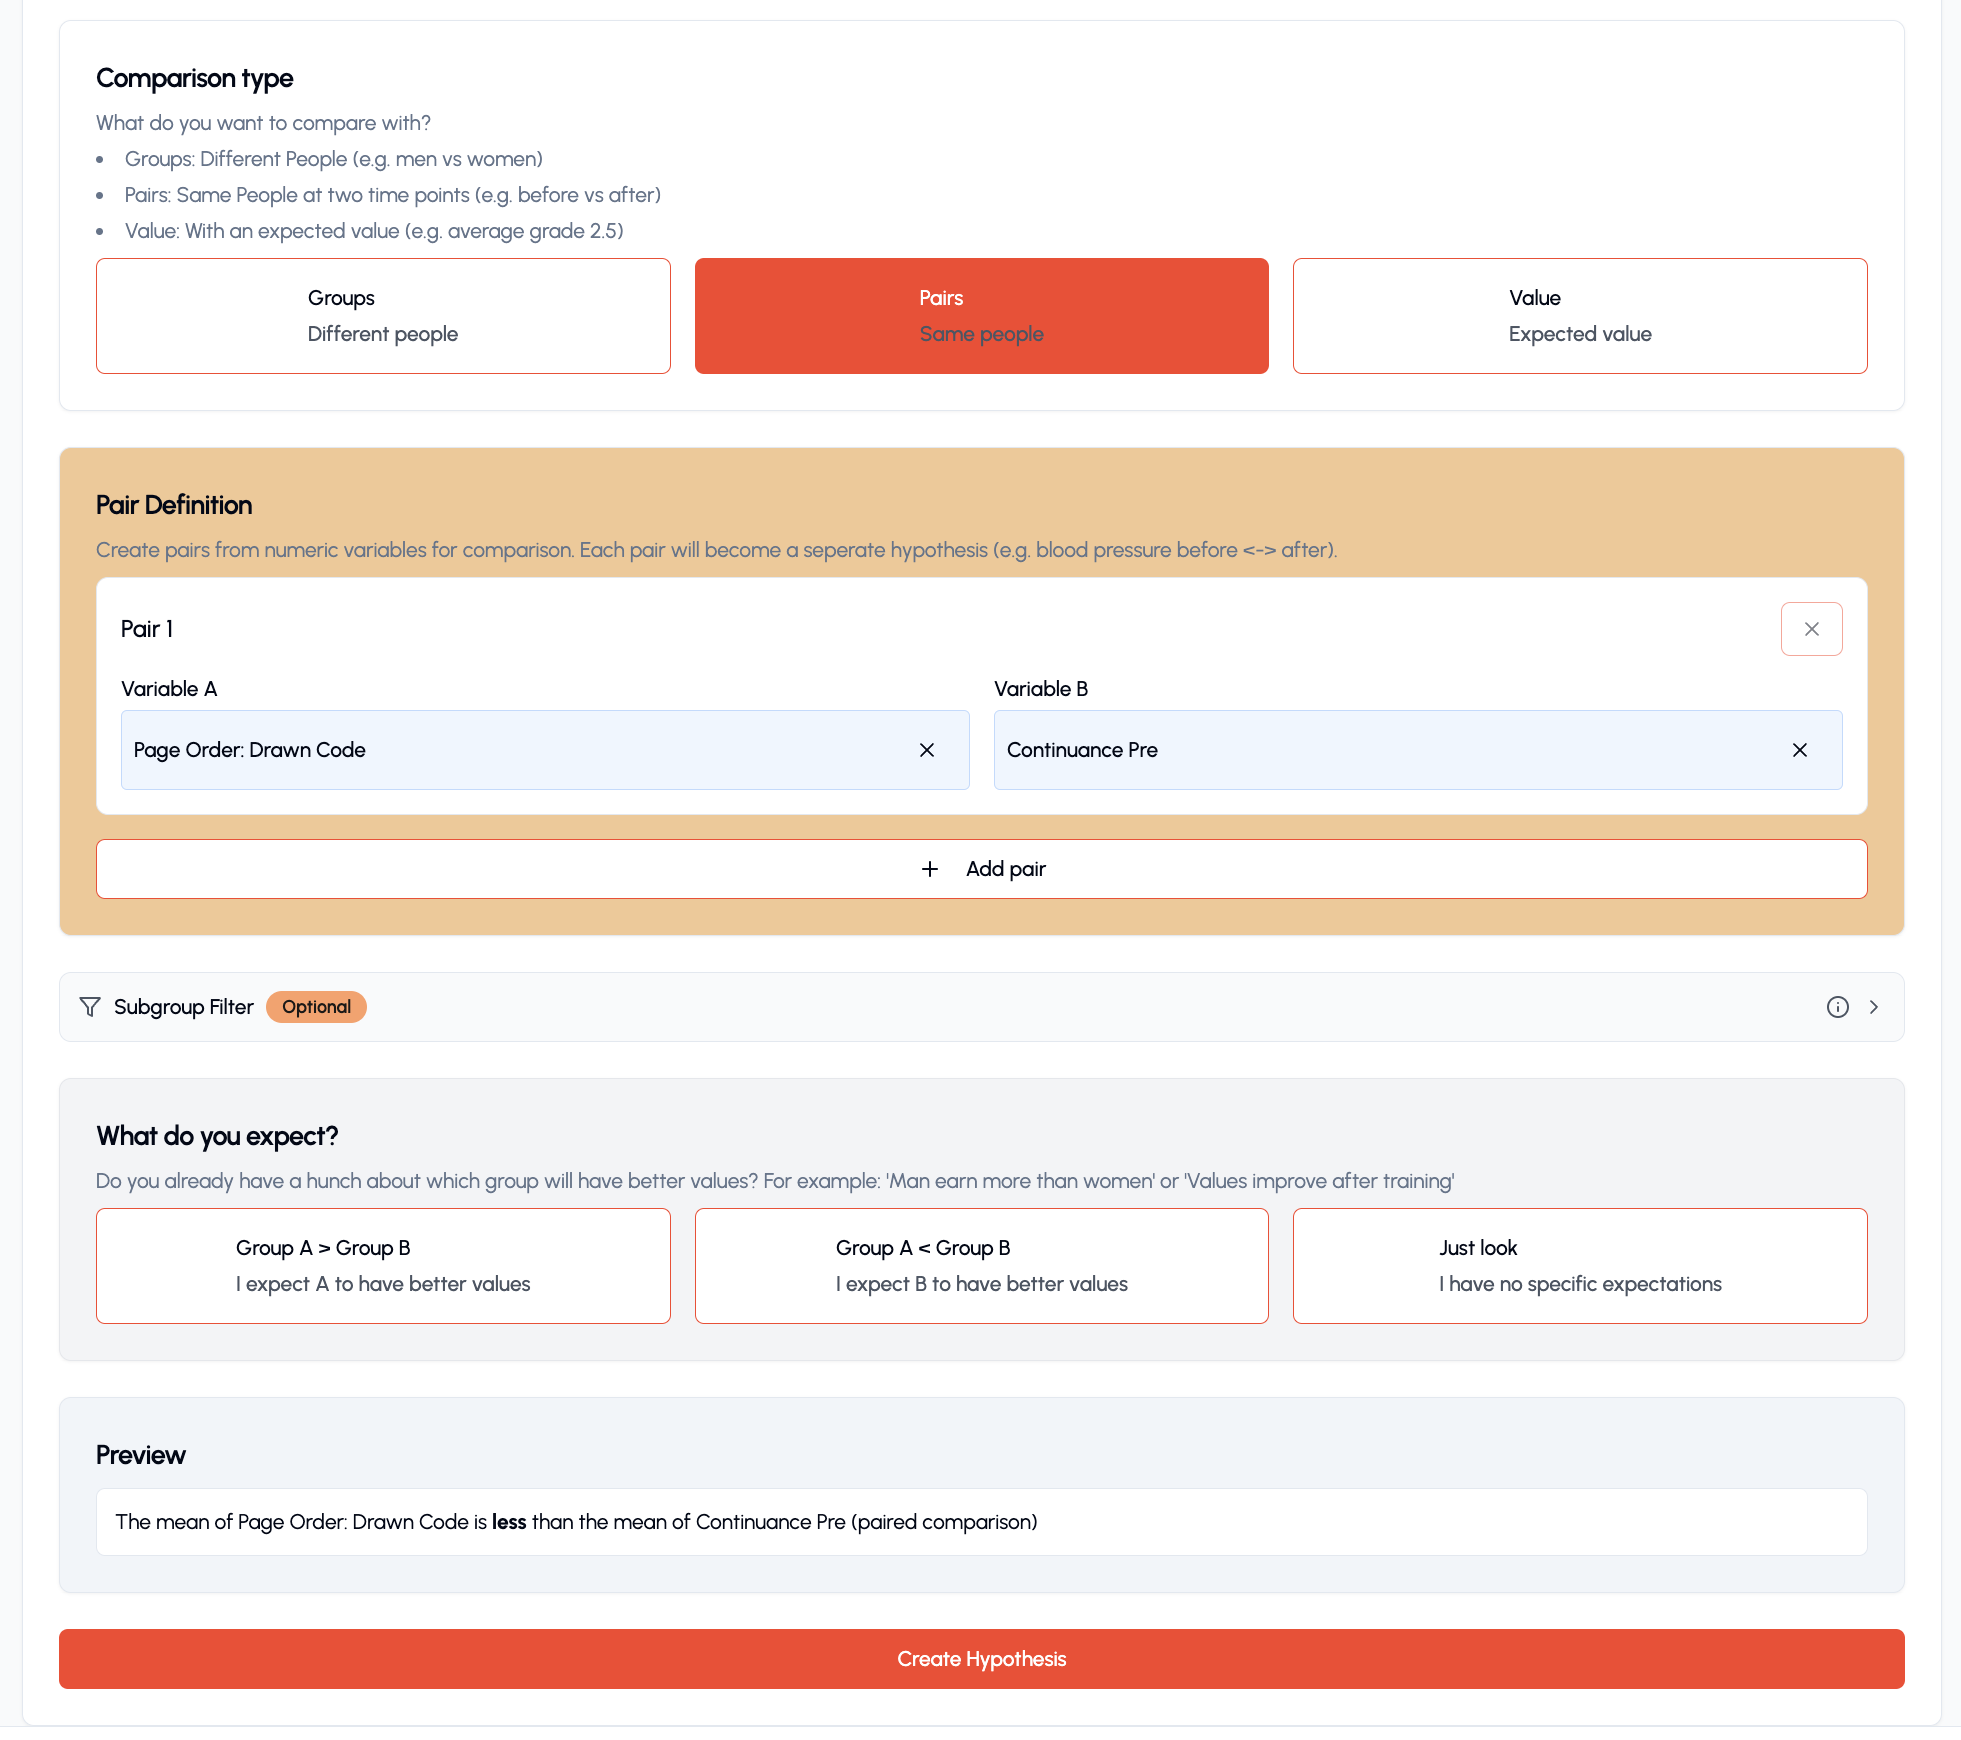
Turn Complex Data into Clear, Actionable Insights
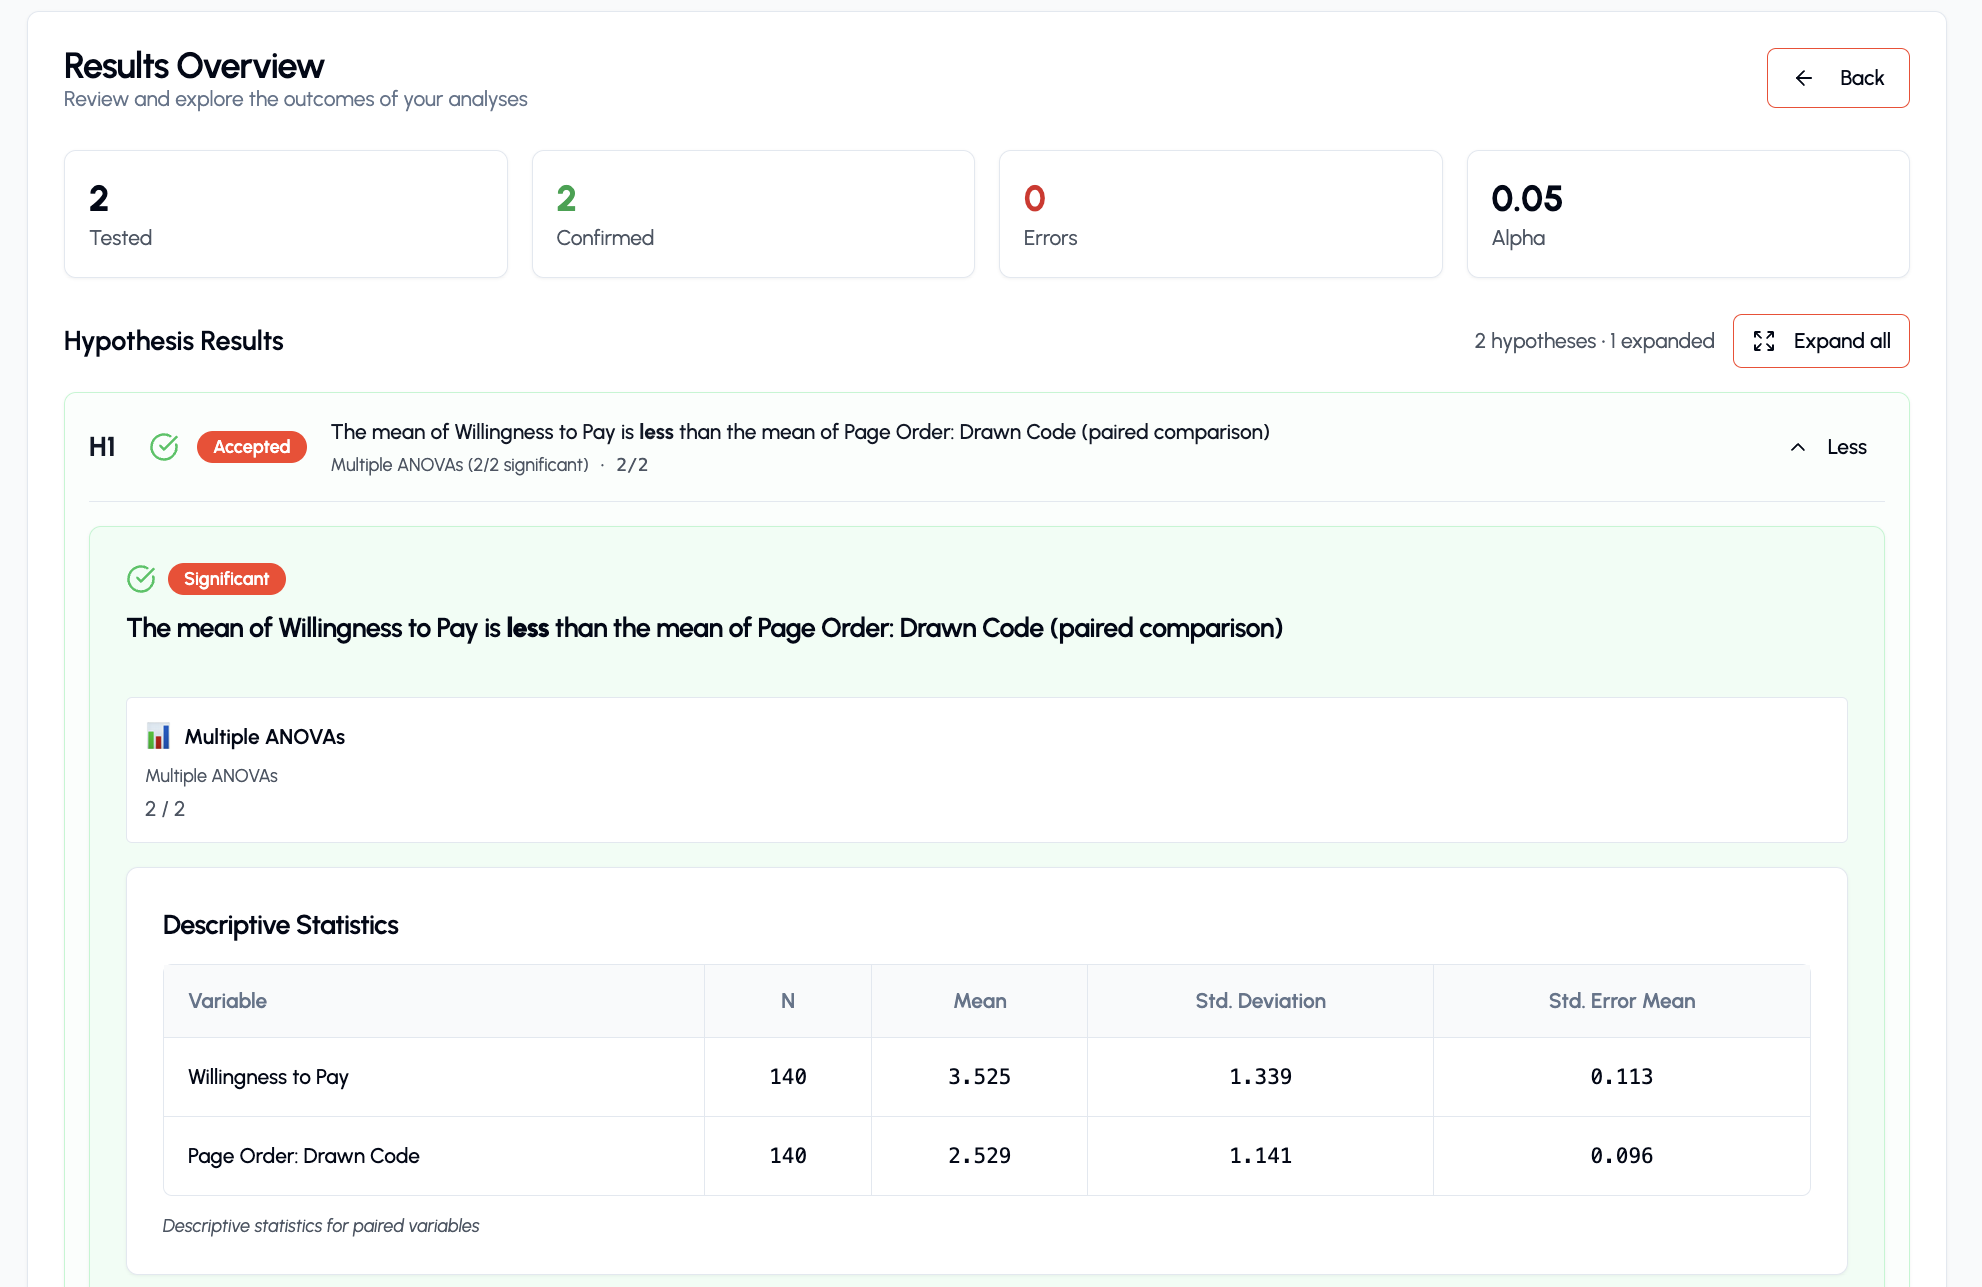
Present results clearly
Experience how your key statistics are highlighted and explained with helpful tooltips. Our clear presentation makes complex results easy to understand and present, allowing you to quickly grasp the implications of your research.
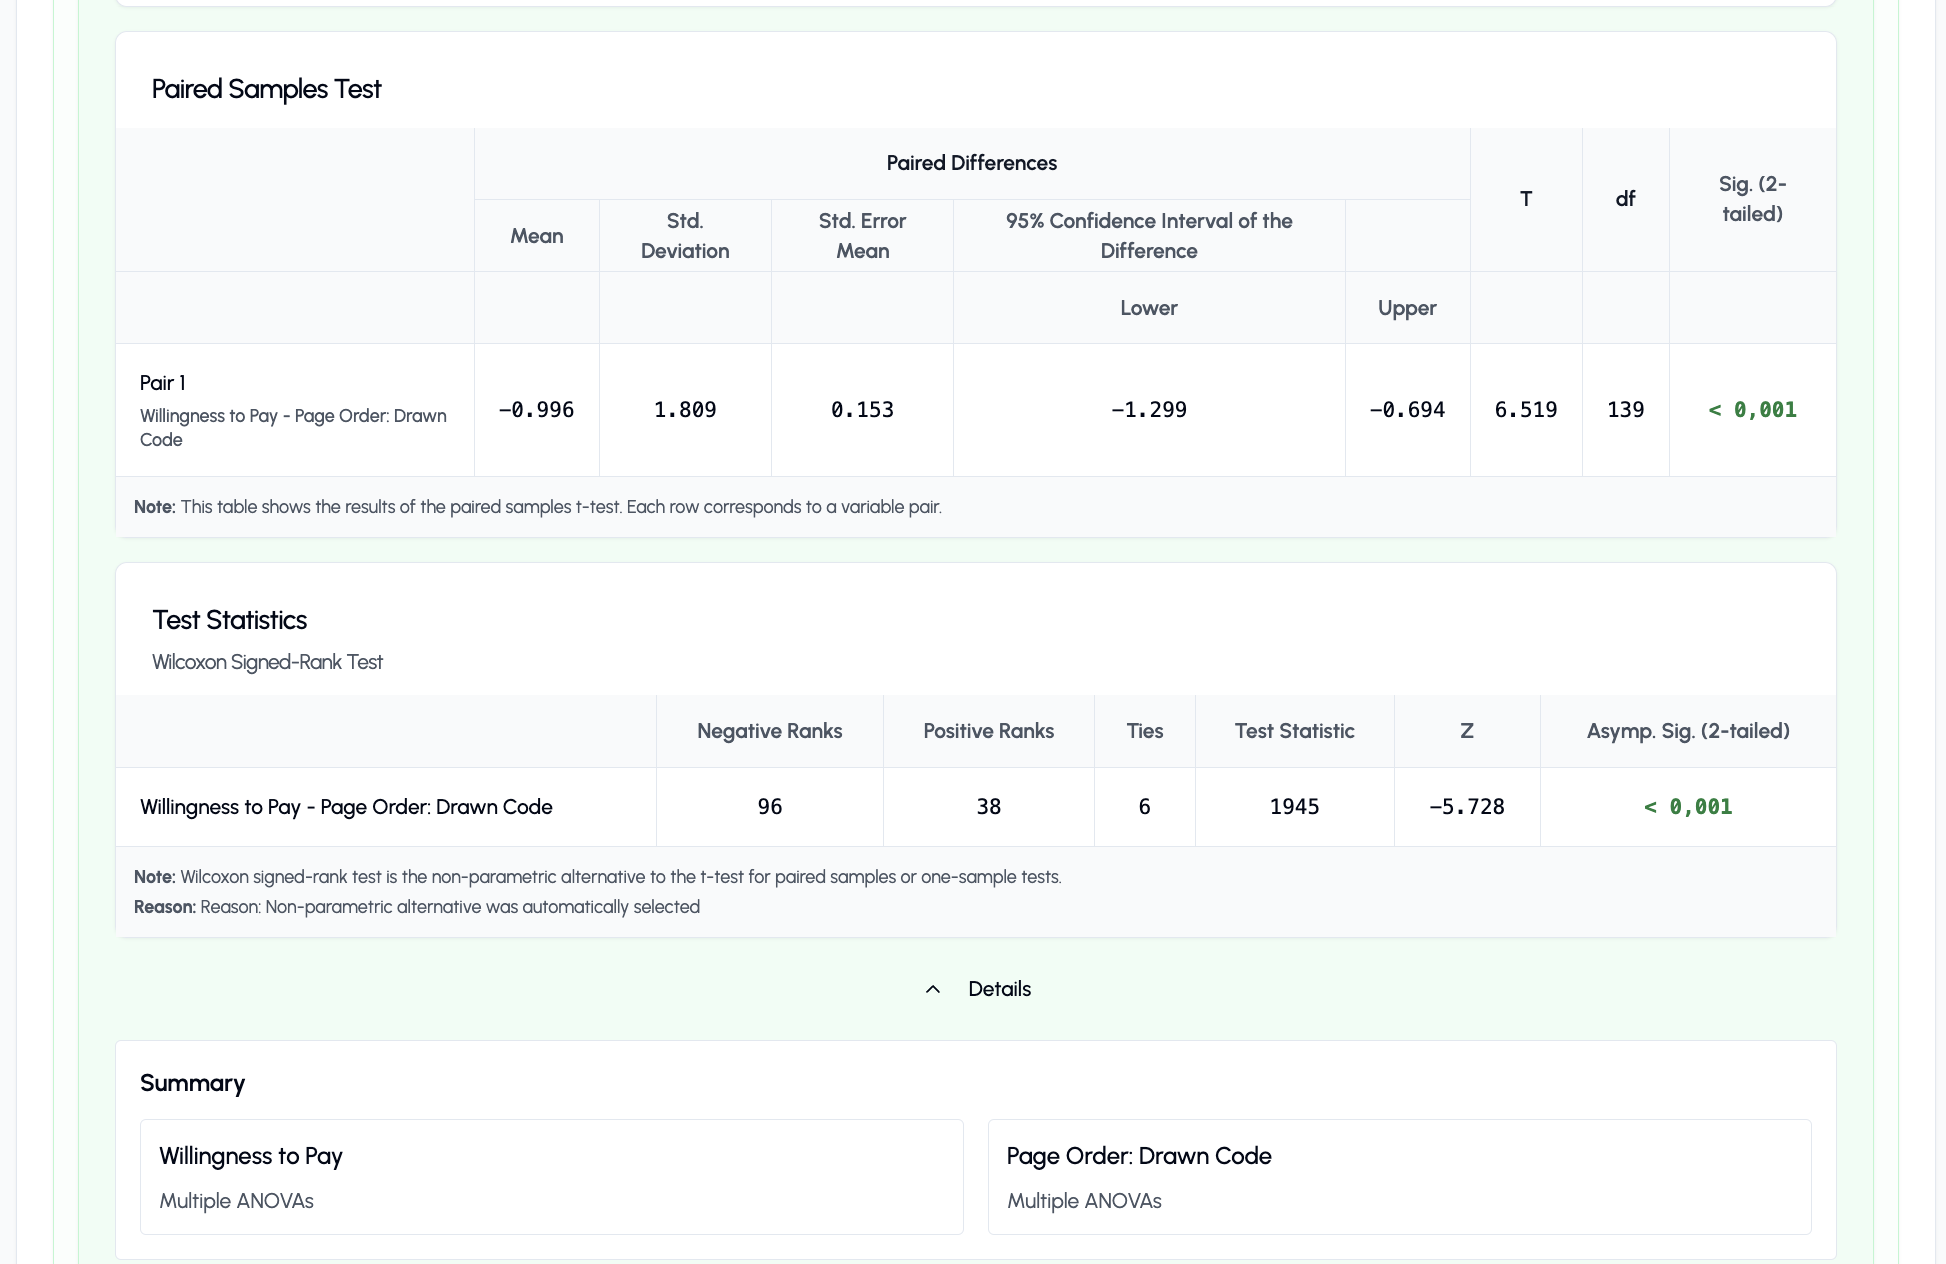
Interpretable Results & Recommendations
Get plain-language explanations of your statistical findings, complete with practical recommendations. Understand not just *what* the numbers say, but *what they mean* for your research questions and next steps, without needing to be a statistics expert.
Get free access now
During the beta phase, the statistics software is completely free.
Software access (free)
No credit card required.
- Guided test selection — no statistics knowledge required
- Dataset workflow: Upload, Analyze, Interpret
- Automatic assumption checks
- APA-ready result interpretation
- All common thesis analyses covered
The software is free during beta. The eBook "Statistics for Your Thesis" is available separately.
Built for students who need practical statistics help
Statoria helps you structure and understand your statistical analysis. Always confirm final methodological decisions with your supervisor.
Your thesis data should stay private. Statoria supports your analysis workflow without making your data public.
What students say about Statoria
From confusion to clear analysis — real experiences from students.
Statoria helped me find the right test for my survey data.
Maria K.
BSc Psychology
I spent three weeks trying to interpret my ANOVA. With Statoria I understood it in 20 minutes.
Simon L.
MSc Business
The Test Finder alone saved my grade.
Tobias R.
BA Sociology
Frequently Asked Questions
Find quick answers to common questions about Statoria and how it can empower your research.