Statistical Analysis Step by Step - Data Analysis Guide for Beginners
When to Use Which Statistical Test?
Learn When to Use t-Test, ANOVA, Chi-Square, Mann-Whitney U, and More
33+ step-by-step guides explaining when to use t-test, when to use ANOVA, when to use chi-square test, when to use Mann-Whitney U test, Kruskal-Wallis, Wilcoxon, Fisher's exact test, Pearson correlation, Spearman correlation, and linear regression - with SPSS click-paths, assumption checks, and APA reporting templates for thesis students.
When to use t-testWhen to use ANOVAWhen to use chi-squareMann-Whitney U testKruskal-WallisNormality testsp-valuesAPA reporting
Updated May 2026 · Beginner-friendly · No prior statistics knowledge required
Step-by-Step Data Analysis Guides - Know When to Use t-Test, ANOVA, Chi-Square, and More
Learn when to use parametric vs nonparametric tests, assumption checks (normality tests, Levene test), and APA reporting for your thesis.
With video walkthrough
Test selection
Which Statistical Test to Use for Your Thesis: A Complete Decision Guide
Choosing the wrong statistical test is the #1 reason supervisors send thesis drafts back for revision. It is not about memorising formulas - it is about answering four questions in the right order. Get them right and your test choice becomes obvious. This guide gives you a step-by-step decision framework, a comparison table covering every common thesis test, and copy-paste methods section text you can use immediately.
Thesis Data Analysis: The 5 Critical Steps Students Skip (With Checklist)
Stop right now if you do not have a structure for your data analysis. Most students think data analysis is complicated because they treat it as a single chaotic phase. In reality, it is a simple five-step structure. Follow it in order and you will get a good grade.
The 5 Thesis Statistics Mistakes That Cost Students Their Grade (And How to Catch Them Before Your Defense)
Most thesis statistics mistakes are not random - the same five errors appear in thesis after thesis. They are not caught because they look correct in SPSS output. This guide identifies each one, explains why it happens, and gives you a pre-submission checklist to catch them before your supervisor does.
How to Prepare Your Thesis Data: Step-by-Step Guide for SPSS, Excel, and Jamovi
Data preparation is where most thesis students lose two to three days - or worse, discover critical errors during their defense. Preparing your data correctly means structuring rows and columns properly, coding variables with the right measurement level, recoding reversed Likert items, computing composite scores, and checking for outliers before you run a single test. This guide covers all five steps with SPSS, Excel, and Jamovi instructions.
Thesis Statistics Timeline: When to Start and How Long Each Phase Takes
Thesis statistics is almost always the most time-consuming part of the process - and the part students underestimate most. Most students leave data analysis too late, rush their SPSS work, and end up rewriting their results section after supervisor feedback. This guide gives you a realistic thesis statistics timeline: when to start planning, how long each phase realistically takes from data cleaning to APA write-up, and a 6-week plan that builds in buffer for feedback cycles.
Statistical Test Selection - When to Use Which Test
Each guide explains when to use t-test, ANOVA, chi-square, Mann-Whitney U, Kruskal-Wallis, Wilcoxon, Fisher's exact test, Pearson correlation, Spearman correlation, or linear regression - covering assumption checks (normality tests, variance assumptions), SPSS steps, effect size, and APA reporting.
Statistical tests
T-Test for Your Thesis: Complete Guide with Assumption Checks, Effect Size, and APA Copy-Paste Templates
The t-test is the most reported statistical test in student theses - and the one most often reported incorrectly. Skip the Shapiro-Wilk normality check and your supervisor will flag it in your defense. Report p < .05 without Cohen's d and you are missing half the story. This guide gives you exact software menu paths for three t-test types, a step-by-step assumption checklist, Cohen's d benchmarks, and ready-to-paste APA sentences for every outcome.
One-Way ANOVA for Your Thesis: Complete Guide with Post-Hoc Tests, Effect Size, and APA Templates
ANOVA is an omnibus test - it tells you that at least one group mean differs, but not which ones. That is why a significant F-statistic is only the beginning: you still need post-hoc tests to identify the specific pairs and effect size to quantify the magnitude. This guide walks through the three assumptions to check before running ANOVA, the Tukey vs. Games-Howell decision, eta-squared interpretation, and ready-to-paste APA sentences.
When to Use a t-Test: A Simple Guide for Thesis Students
When to use a t-test is one of the first decisions every thesis student faces after collecting data. The t-test compares means — but only under specific conditions, and there are three different versions depending on your research design. This guide explains which type fits your situation, the four conditions your data must meet, and how to report results in APA format.
When to Use a Chi-Square Test: Explained for Beginners
When to use a chi-square test depends on one thing: whether both your variables are categorical. It is the go-to test when your hypothesis involves proportions, frequencies, or the relationship between two grouping variables — not means. This guide explains the ≥5 expected frequency rule, when to switch to Fisher’s exact test, and how to report Cramér’s V as your effect size.
When to Use ANOVA — and When to Use Something Else
When to use ANOVA is straightforward once you know the rule: three or more groups, one metric dependent variable, and you want to compare means. ANOVA avoids the inflated error rate that comes from running multiple t-tests. This guide explains the difference between one-way, two-way, and repeated measures ANOVA, how to check its two key assumptions, and how to report η² in APA format.
When to use the Mann-Whitney U test comes down to one situation: you want to compare two independent groups, but the normality assumption for a t-test cannot be met. Mann-Whitney U is the non-parametric alternative — it compares rank distributions instead of means and works reliably with small samples and ordinal data. This guide covers the decision, the SPSS steps, and APA reporting with effect size r.
When to Use the Wilcoxon Test and What It Actually Is
When to use the Wilcoxon signed-rank test is a one-sentence answer: when you have a before/after design (paired data) but the difference scores are not normally distributed. It is the non-parametric replacement for the paired samples t-test and is common in intervention studies. This guide explains how it works, how to run it in SPSS, and how to report it in APA format.
When to use the Kruskal-Wallis test is the non-parametric version of a familiar decision: when you have three or more groups but the normality assumption for ANOVA cannot be met. It compares rank distributions across groups and is a reliable alternative for small samples or ordinal dependent variables. This guide explains the H statistic, post-hoc follow-ups, and APA reporting.
When to Use Fisher’s Exact Test Instead of Chi-Square
When to use Fisher’s exact test instead of chi-square comes down to one diagnostic: whether your cross-table has cells with expected frequencies below 5. Chi-square becomes unreliable with small expected counts — Fisher’s exact test solves this for 2×2 tables. This guide explains the rule, when it applies, how SPSS handles it automatically, and how to report the Odds Ratio as your effect size.
The Stratification Fallacy: How Wrong Population Assumptions Ruin Your Statistics
If you want to ruin your statistics, do this: take a national population, subdivide it by demographic criteria, and announce that your target group has a 0.021% chance of existing. This is the stratification fallacy - and it appears in thesis research more often than you think.
Likert Scale Analysis in Your Thesis: Which Statistical Test to Use
Likert scale data is the most common data type in student theses - and the one most often analysed with the wrong statistical test. Your supervisor will ask in your defense: 'Why did you use a parametric t-test on a 5-point Likert scale?' This guide gives you the defensible answer: when ordinal Likert data requires Mann-Whitney instead of t-test, when Kruskal-Wallis beats ANOVA, and how to report Likert results in APA format.
Outlier Removal Guide: Conservative vs. Aggressive Choices
Outlier removal guide decisions get stressful when your data cleaning screen shows many flagged values and you do not know whether to delete only the worst rows or every suspicious case. This guide gives you a conservative rule, an aggressive rule, and a practical review workflow for IQR and z-score outliers in thesis data. When your supervisor asks why you deleted a row, you will have a defensible answer instead of a guess.
Thesis Statement Example and Research Hypothesis: How to Write One That Works
Your thesis statement and research hypothesis are the foundation every statistical decision rests on - get them wrong and no analysis can save you. A weak or untestable hypothesis forces you to retrofit your methods, write around your results, and face revision requests from your supervisor. This guide gives you a concrete formula for writing a testable hypothesis, worked examples across different thesis types, and a direct map from your hypothesis wording to the correct statistical test.
Pearson vs. Spearman Correlation: Which to Use for Your Thesis Data (2-Question Decision Framework)
Your supervisor will ask in your thesis defense: 'Why did you use Pearson and not Spearman correlation?' The choice follows from exactly two questions about your data - and this guide gives you both, with a decision table, APA templates, and the one rule that prevents the most common thesis correlation mistake.
Linear Regression for Your Thesis: Complete Guide with R², Coefficients, VIF, and APA Templates
Linear regression outputs R², B coefficients, β values, VIF scores - and most thesis students report only half of them. This guide explains every value in your SPSS or Jamovi output, gives you field-specific R² benchmarks, shows the B vs. β distinction clearly, and provides ready-to-paste APA sentences for significant and non-significant predictors.
When to use Pearson vs. Spearman correlation is one of the most common method questions in thesis research. Both tests measure the relationship between two variables, but they apply under different conditions. Pearson requires metric data and a linear relationship; Spearman is appropriate when those conditions are not met. This guide walks you through the decision, the checks you need to run, and the APA reporting format for both.
When to use linear regression is a question about your research question, not just your data type. Regression goes one step beyond correlation: it lets you predict an outcome from one or more predictors and quantify how much variance each predictor explains. This guide explains when regression is the right choice, how to check the four key assumptions in SPSS, and how to report R², β, and p-values in APA format.
P-Value Explained: What p < .05 Really Means, Common Myths, and How to Report It Correctly in APA
The p-value is the most reported and most misunderstood number in thesis statistics. Most students can state that p < .05 means significant - but cannot explain what it actually means when a supervisor asks. This guide gives you the correct definition, debunks the five most common myths written in student theses, and shows the exact APA reporting rules including the one formatting error that appears in almost every first draft.
Confidence Interval Explained: What It Means and How to Report It in APA
Almost every published study reports confidence intervals - and almost every student misinterprets them. Saying 'there is a 95% probability the true value lies within this interval' is technically wrong and will lose you marks in your thesis defense. Here is the correct interpretation of a 95% confidence interval, how it relates to your p-value, and the exact APA format for reporting CIs across t-tests, ANOVA, regression, and correlation.
Standard Deviation in Excel: How to Calculate, Interpret, and Report It Correctly in APA Format
Standard deviation is the first descriptive statistic every thesis results section reports - and the one most often calculated wrong or confused with standard error. The wrong Excel formula gives you the wrong number silently. Reporting SEM instead of SD makes your data look far more consistent than it is. This guide shows you which formula to use, how to distinguish SD from SEM, and the exact APA format.
Histogram Explained: How to Create, Read, and Use One for Thesis Normality Checks
A histogram is the first plot you should create for any metric variable in your thesis. It shows the shape of your distribution in 30 seconds - and tells you whether parametric tests like t-test and ANOVA are appropriate before you run a single analysis. This guide shows how to create a histogram in SPSS and Excel, how to read all five distribution shapes, and how to combine it correctly with Shapiro-Wilk for a complete normality check.
Box Plot Explained: How to Read and Use One for Thesis Group Comparisons
A box plot packs five key statistics - minimum, Q1, median, Q3, and maximum - into one diagram. Once you know how to read the IQR, whiskers, and outlier dots, you can instantly assess skewness, spread, and extreme values. This is exactly why supervisors expect box plots alongside t-tests and ANOVA: they show the distributions being compared and make your thesis data analysis more transparent.
Best Free SPSS Alternatives for Students in 2026: JASP, Jamovi, and R Compared
IBM SPSS costs €130–200 per year. Most university licenses expire at graduation - exactly when you need to revise your thesis. The good news: free alternatives have improved dramatically. But 'free' does not mean 'the same.' Each tool has strengths, blind spots, and a learning curve that can cost you days if you choose wrong. This guide gives you an honest comparison of the best free SPSS alternatives - no sponsored content, no affiliate links.
APA Statistics Reporting: Copy-Paste Templates for Every Test in Your Thesis
APA statistical reporting is stricter than most students expect - and the formatting errors reviewers flag most often are the easiest to fix. The most common mistakes: reporting p = .000 instead of p < .001, using a leading zero (p = 0.05 instead of p = .05), and omitting effect size. Use these copy-paste APA format templates for every common thesis statistical test and you won't need to guess again.
This Psychology Student Asked ChatGPT 3 Times. Here's Why That Nearly Ruined Her Thesis
ChatGPT sounds authoritative when answering statistics questions. Empirical research shows it gets most of them wrong. Here is what actually happened when a psychology student used it for her thesis - and what the studies say about AI-generated statistical advice.
Linear Regression in Jamovi: Step-by-Step Guide for Thesis Students
Jamovi makes linear regression as fast as clicking through three menus. But fast execution and correct execution are different things. This guide shows you exactly how to run simple and multiple linear regression in Jamovi - from loading your data to interpreting the output and copy-pasting APA-formatted results into your thesis.
JASP vs Jamovi vs SPSS for Your Thesis: The Complete Comparison
SPSS is the established standard. JASP and Jamovi are free, modern, and increasingly adopted in universities. But 'free' does not mean 'equivalent' - each tool has real differences in test coverage, output format, learning curve, and supervisor acceptance. This guide compares all three across every dimension a thesis student cares about, so you choose once and spend your time on analysis, not on learning new software.
How to Write the Statistics Results Section of Your Thesis
The results section is where most students lose marks without understanding why. The analysis is correct - but the reporting is incomplete, the format violates APA rules, or the narrative and numbers contradict each other. This guide shows you exactly what to include, in what order, and what not to write - with copy-paste templates for every common thesis test.
Most students get stuck at this step. Walk through the five decisions that take you from a vague idea to a working analysis - before touching any software.
1
Build a Testable Hypothesis
Start with a hypothesis so precise that your data needs become obvious.
Most students lose days because their hypothesis is too broad. "Coffee is bad for your sleep" does not tell you what to measure. "People who do not drink coffee have better sleep quality than people who drink coffee" tells you exactly what you need: two groups, one sleep measure. If your hypothesis is vague, your method research becomes endless. If it is precise, the test choice becomes automatic.
2
Design Your Research and Collect Data
Match your data collection to your hypothesis before you open any software.
Your research design must reflect what you want to analyze. Decide upfront: which variables, how many groups, what measurement scale, and how you will handle missing data. Collecting data without a design is building without a blueprint. You will end up with gaps, redundancies, and unusable responses.
3
Prepare Your Data for Analysis
Convert raw responses into clean, analyzable numbers.
Code text labels into numbers - "coffee" and "water" become 0 and 1. Structure one header row, one row per participant, one column per variable. Handle dropouts - online surveys lose 30 to 50% of starters. Keep only the variables your hypothesis demands. Extra variables create noise and confusion.
4
Pre-Analysis - Clean Before You Test
Remove distortions now, or re-run everything later.
Check for outliers - 20 hours of sleep is not a normal participant. Check missing data patterns - are they random or clustered? Check group balance - 500 versus 30 participants distorts your results. Check measurement reliability - inconsistent instruments produce unstable data. Skip this step and you will discover errors after you have already written your results.
5
Choose the Right Statistical Test
Get one clear test in 2 minutes.
Your hypothesis and data type from Steps 1–4 answer this automatically. Most students waste a week comparing tests. Answer these questions in 2 min and get your test instantly.
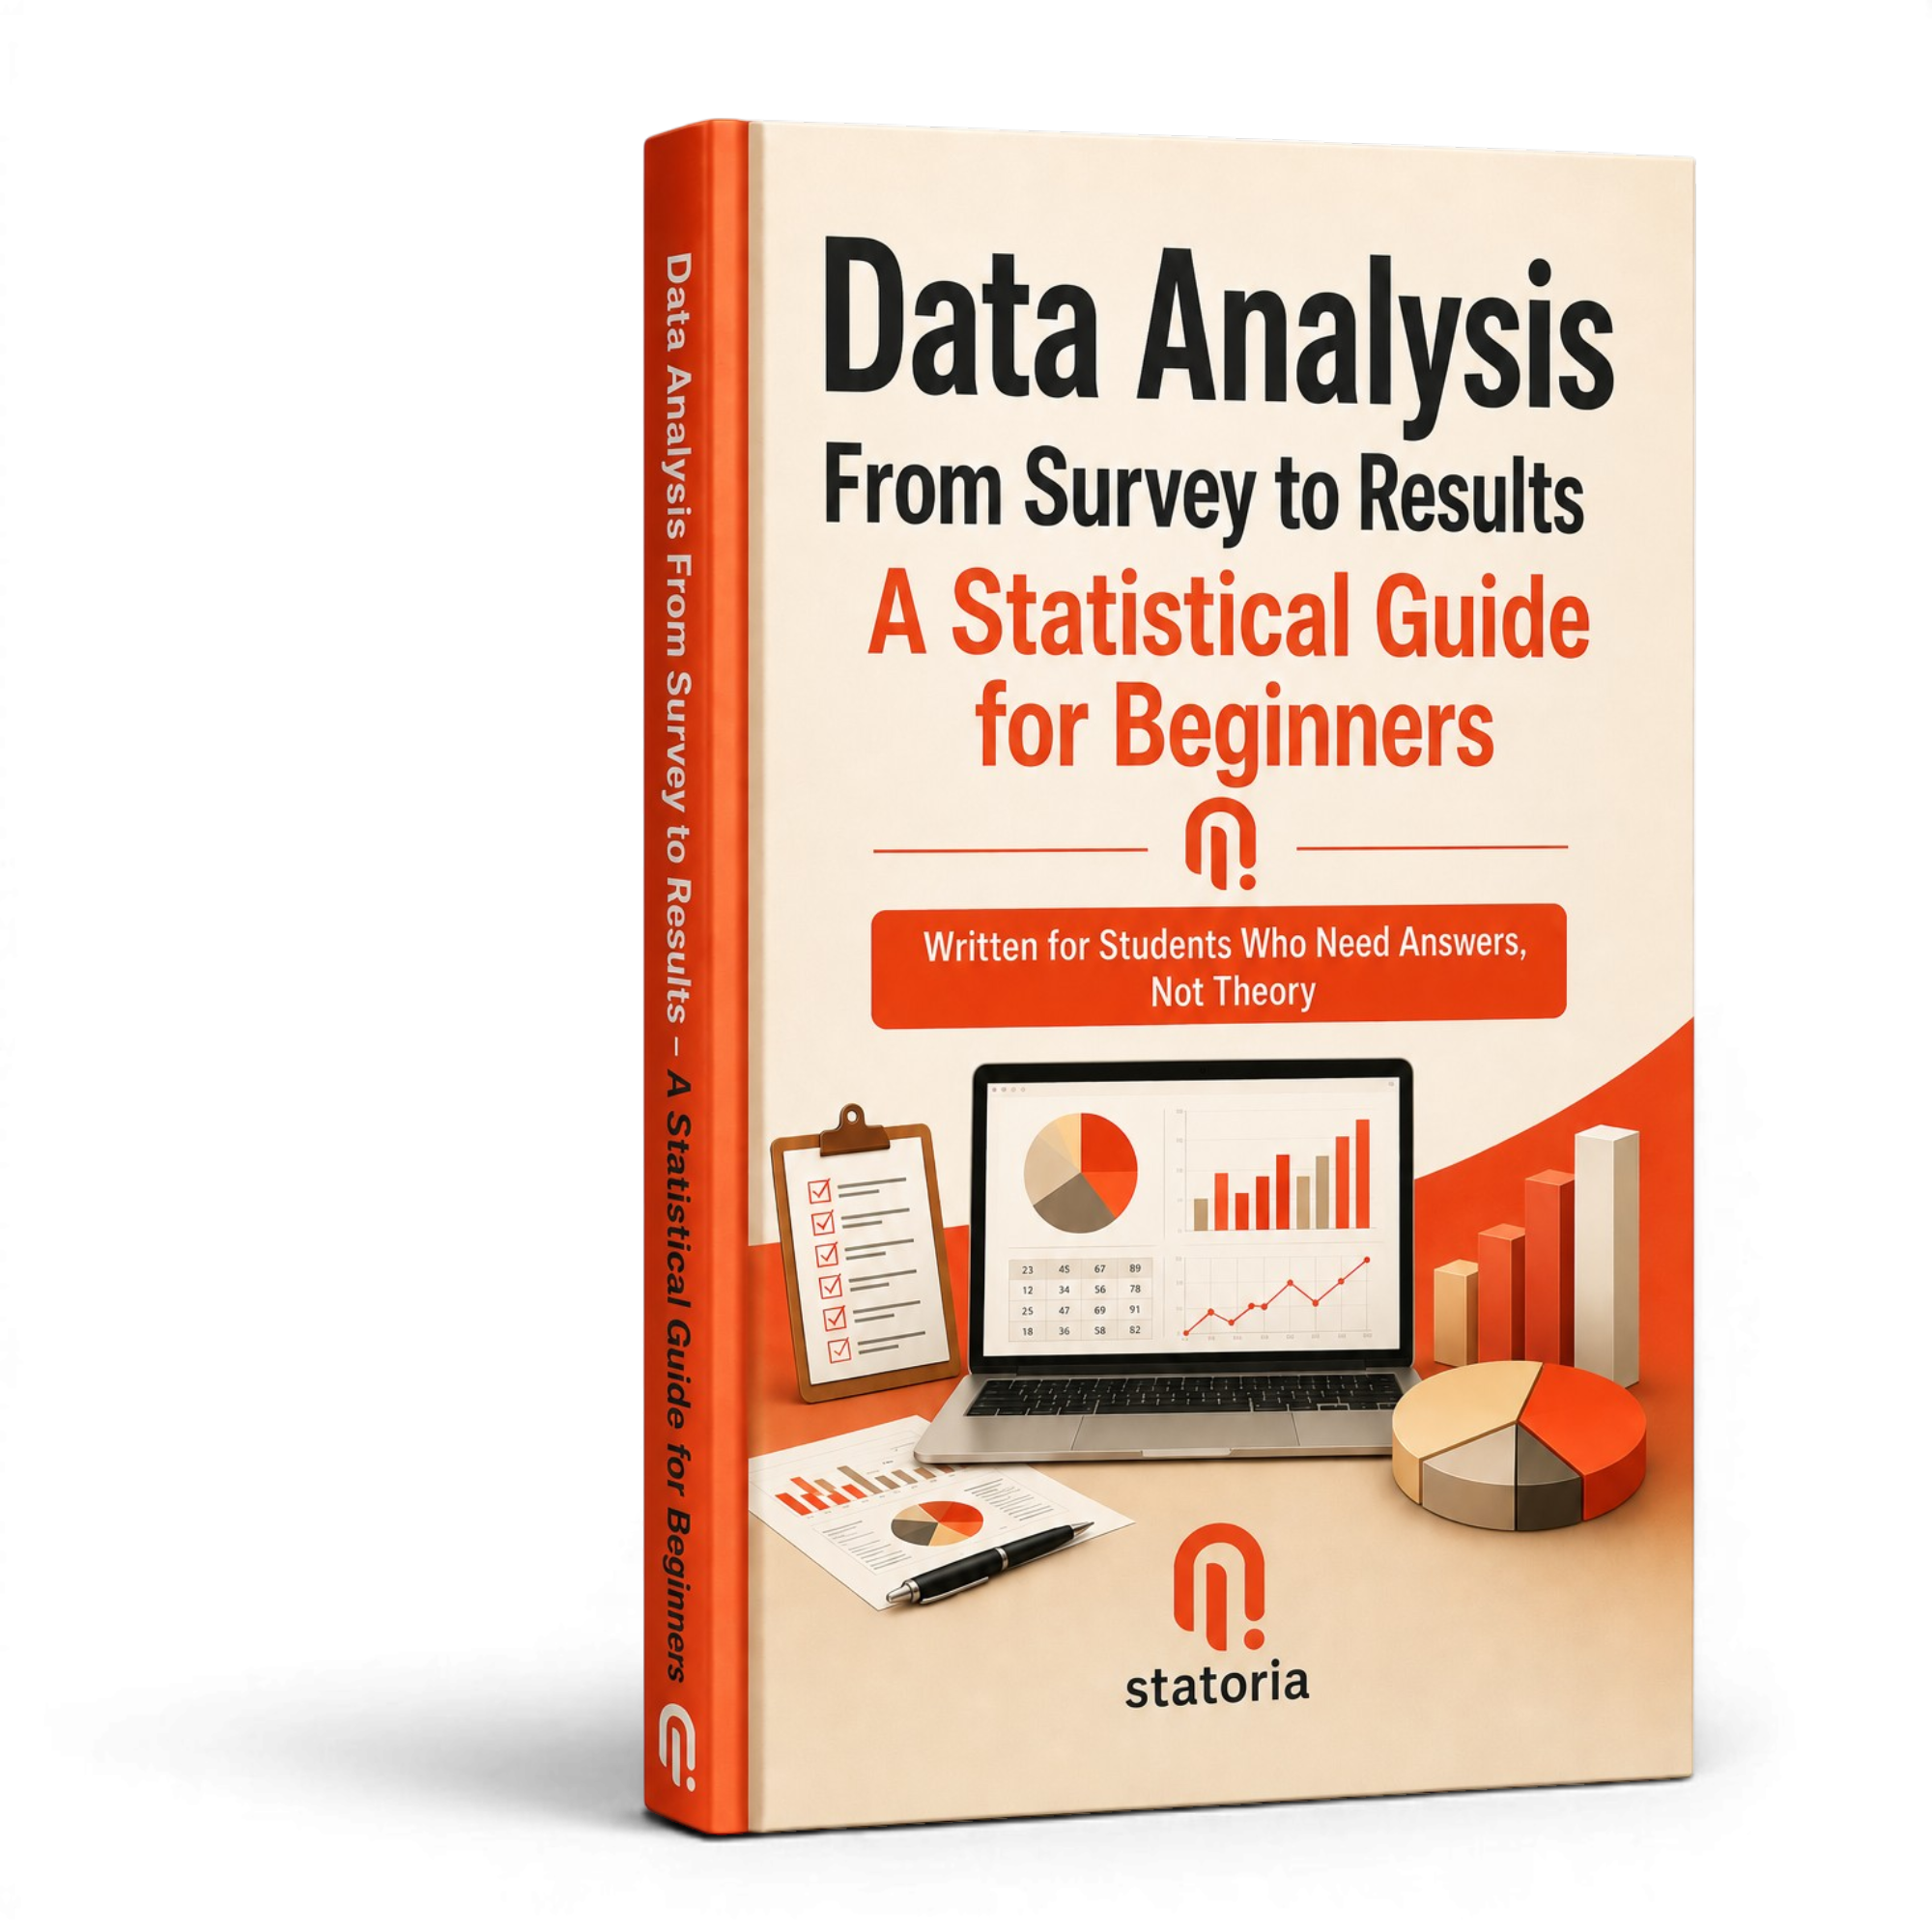
Statistical Analysis Step by Step
A Practical Data Analysis Guide for Beginners
Know When to Use Which Statistical Test - Data Analysis From Survey to Results
Not another theory-heavy textbook. A focused statistical analysis plan for thesis students - with the Statistical Test Finder tool, when to use parametric vs nonparametric tests, real examples, and APA write-up templates you can use immediately.
What's inside
Statistical Test Finder - answers simple questions about your data and tells you when to use t-test, ANOVA, chi-square, Mann-Whitney U, or correlation
Covers t-test, ANOVA, correlation, regression, chi-square, Mann-Whitney, Kruskal-Wallis and more
SPSS click-paths, assumption checks, and APA result write-up templates included
Get Statistical Analysis Tips, Data Analysis Learning Resources, and Hypothesis Testing Guides
Join 500+ thesis students who get 33+ step-by-step statistical analysis tutorials, when to use which test guides, Statistical Test Finder updates, and news about the Statistical Analysis Step by Step handbook.